GEOMARKETING APPLICATION FEATURES
From site selection to strategic location planning
- Quickly analyze any location with demographic, traffic, and business data
- Find best locations based on your target profiles
- Analyse your footprint and your competitors’ presence
- Identify untapped potential at store level
- Optimise your coverage and build optimal expansion plans
Book a customized demo of Symaps today to discover full features !
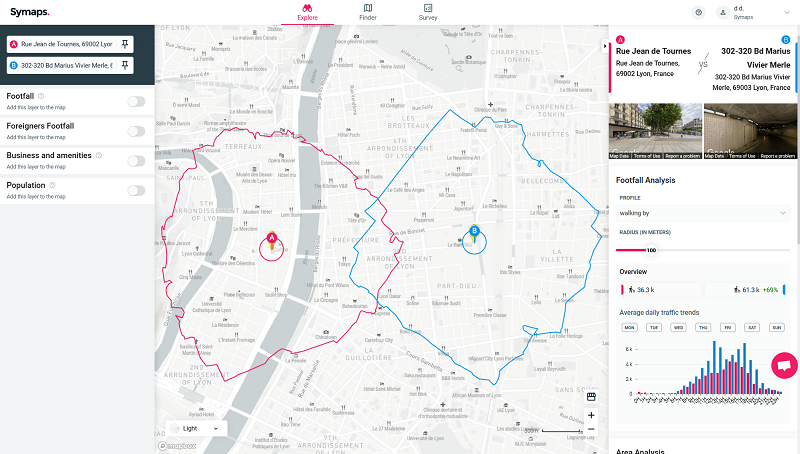
Evaluate market potential with population, footfall and business data
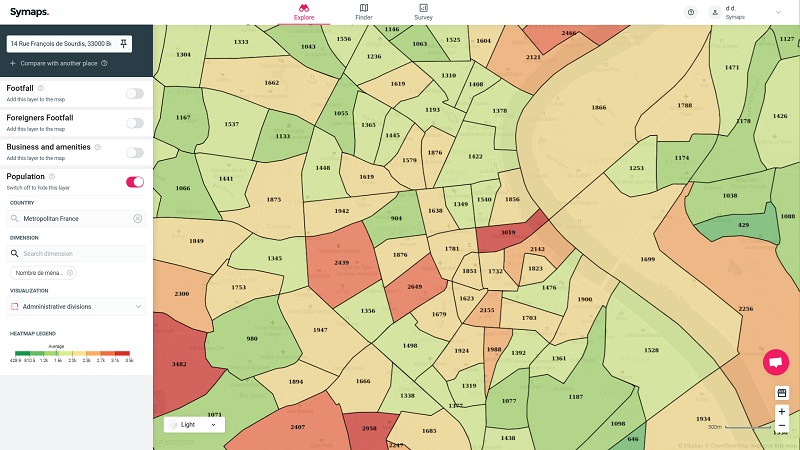
Population & socio-demographics
– Assess the size of the market and the number of potential customers in your target
– Detailed socio-demographics: total population, number of households, age distribution, income distribution, etc.
– Regularly updated data, based on national censuses (Insee,…) and worldwide statistics
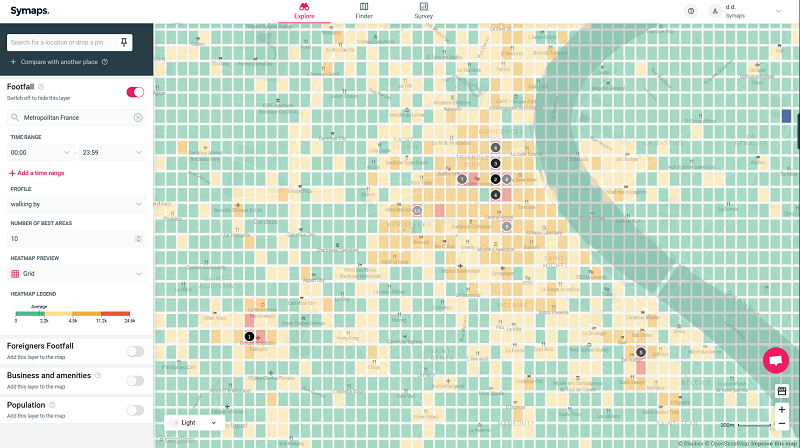
Footfall and Traffic Data
– Pedestrian and vehicles footfall at street level
– Identify traffic patterns and most frequented areas
– 100% GDPR compliant (anonymized data from mobile phones)
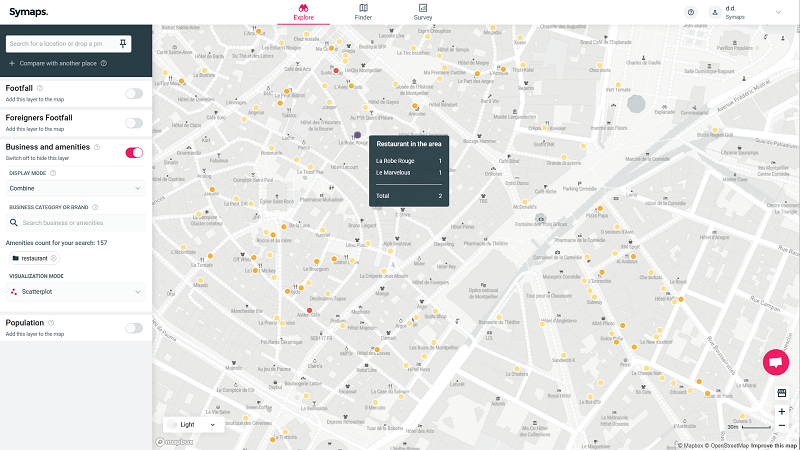
Competitive environment: business & amenities
– Check the location of your your direct and indirect competitors
– See which other retailers and points of interest already exist in the area, by brand or type (restaurant, hospital…)
– Develop your local market knowledge to evaluate your market share
Add layers of geodata and display them on the map in a glimpse
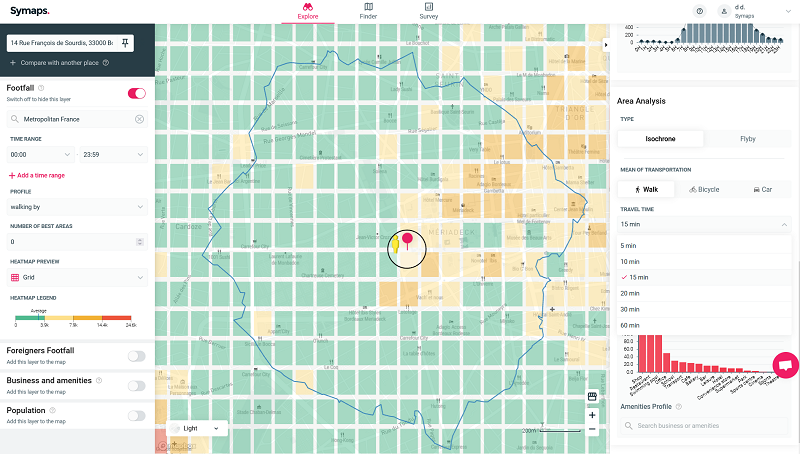
Catchment areas and isochrones
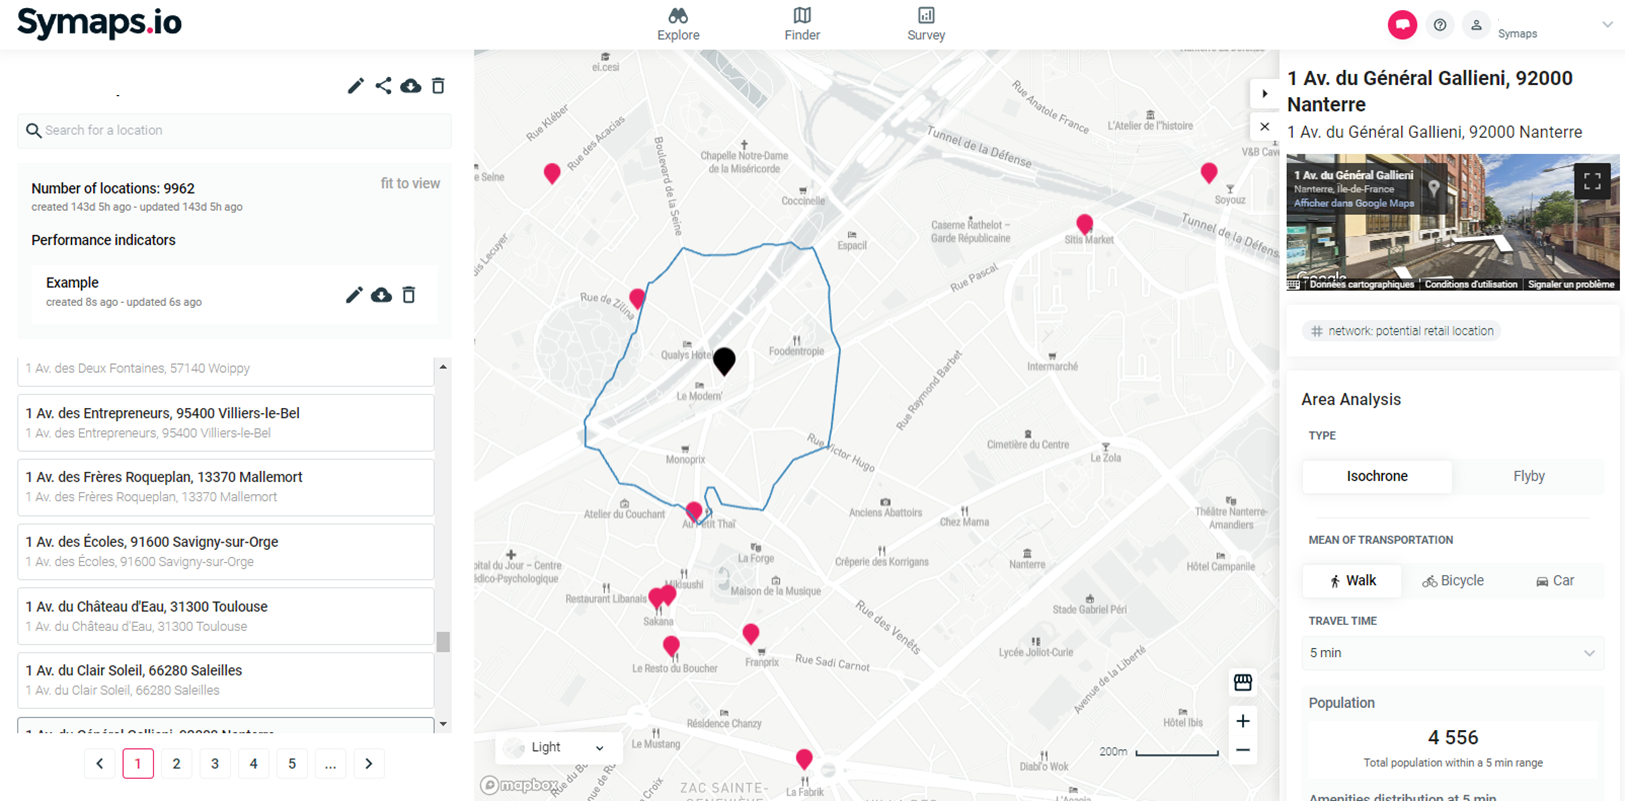
– Choose your travel time by foot, bicycle or car
– Display trade areas (isochrones) around any point
– Get information on population, footfall, business and amenities within the zone
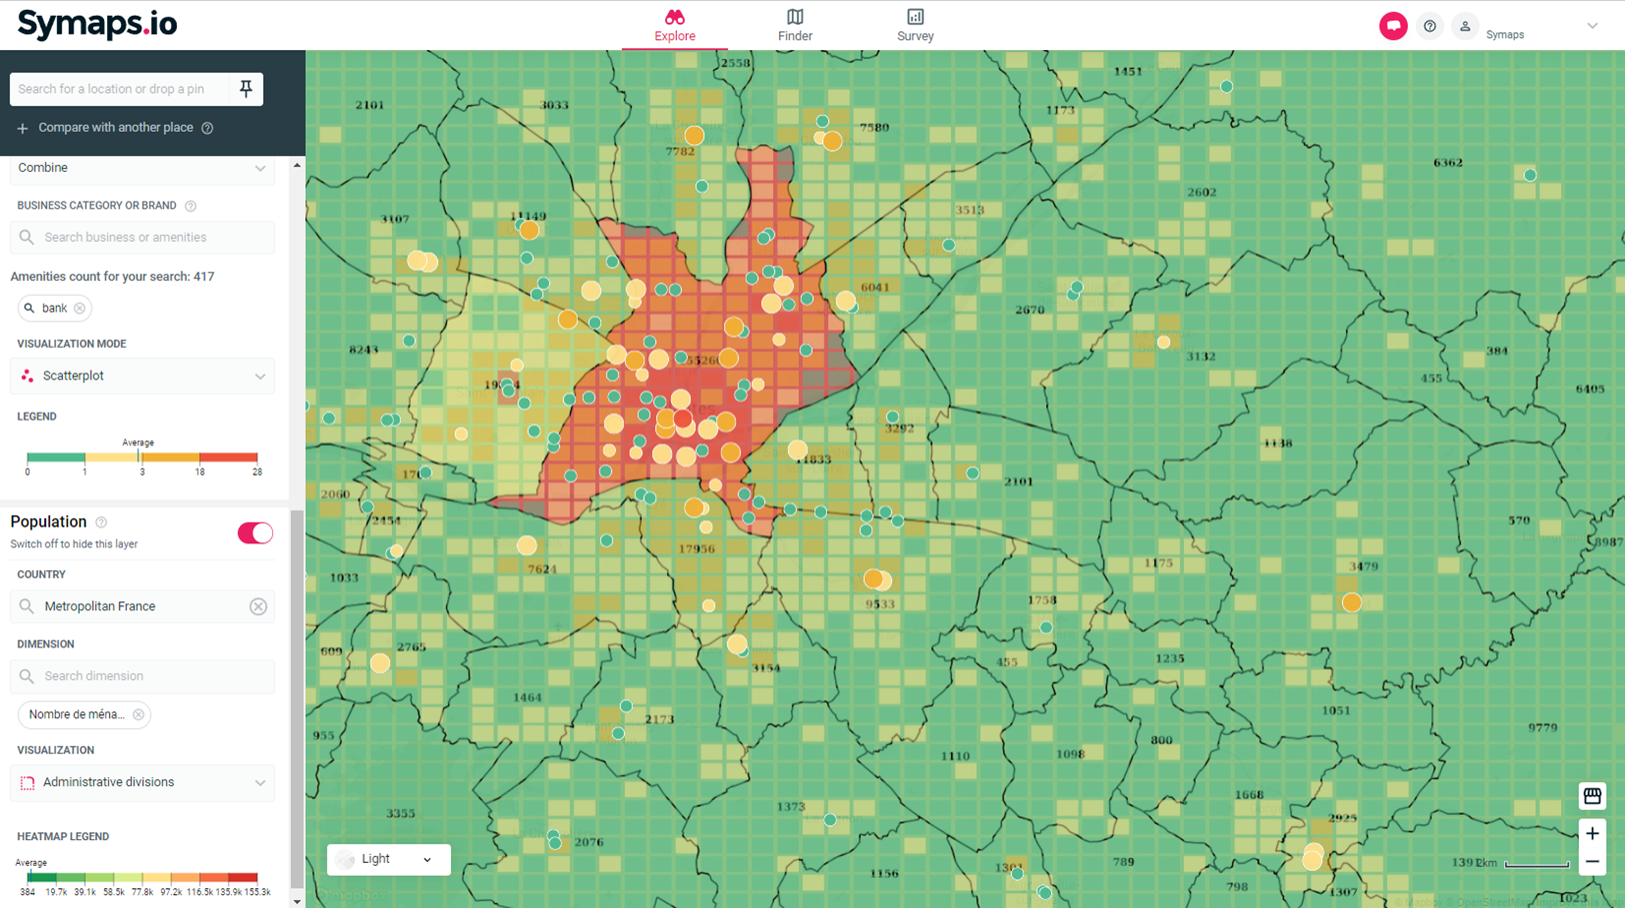
Add layers of data on the map
– Add or hide layers of data on the map according to your analysis
– Available data: population profiles, pedestrian and car traffic, businesses, amenities
– Upload your own stores’ KPIs and display them on the map
For site selection and coverage diagnosis
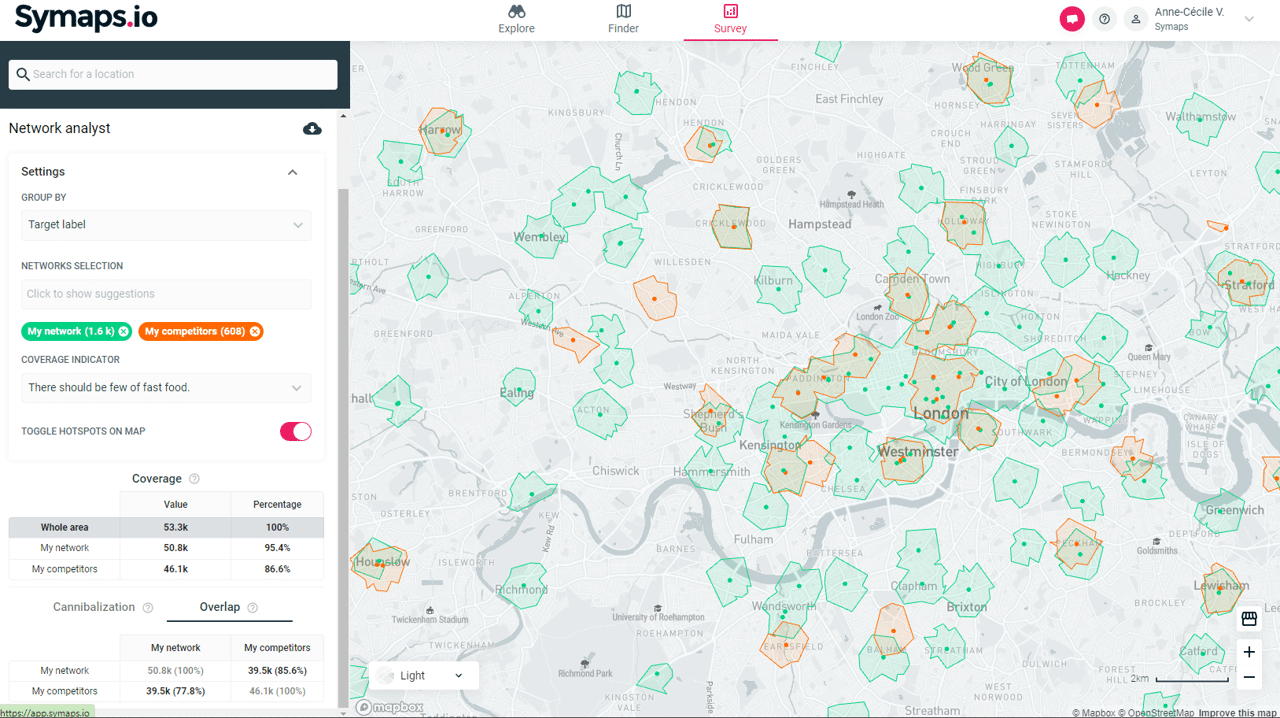
Benchmark with competitors
– Benchmark your coverage with competitor’s footprint
– Analyse coverage and penetration rate on selected target profiles
– Identify overlaps with main competitors
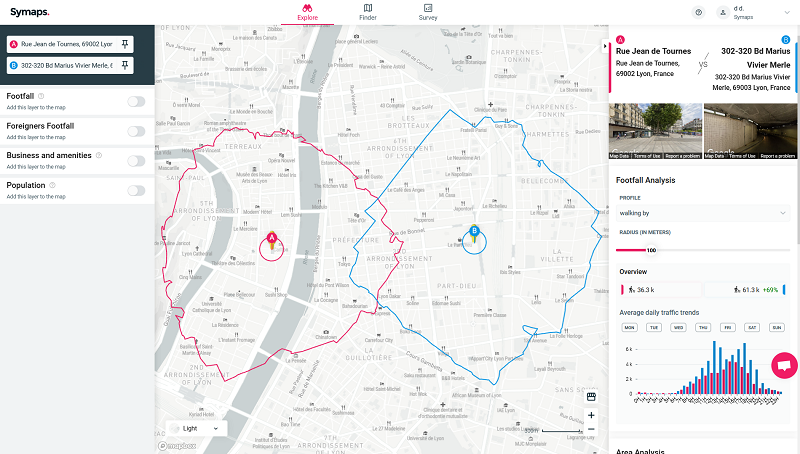
Compare two locations
– Select two locations directly on the map
– Display trade areas and get instant comparison of their population profile, footfall and competitive environment
Use AI to plan your expansion and optimise your current coverage
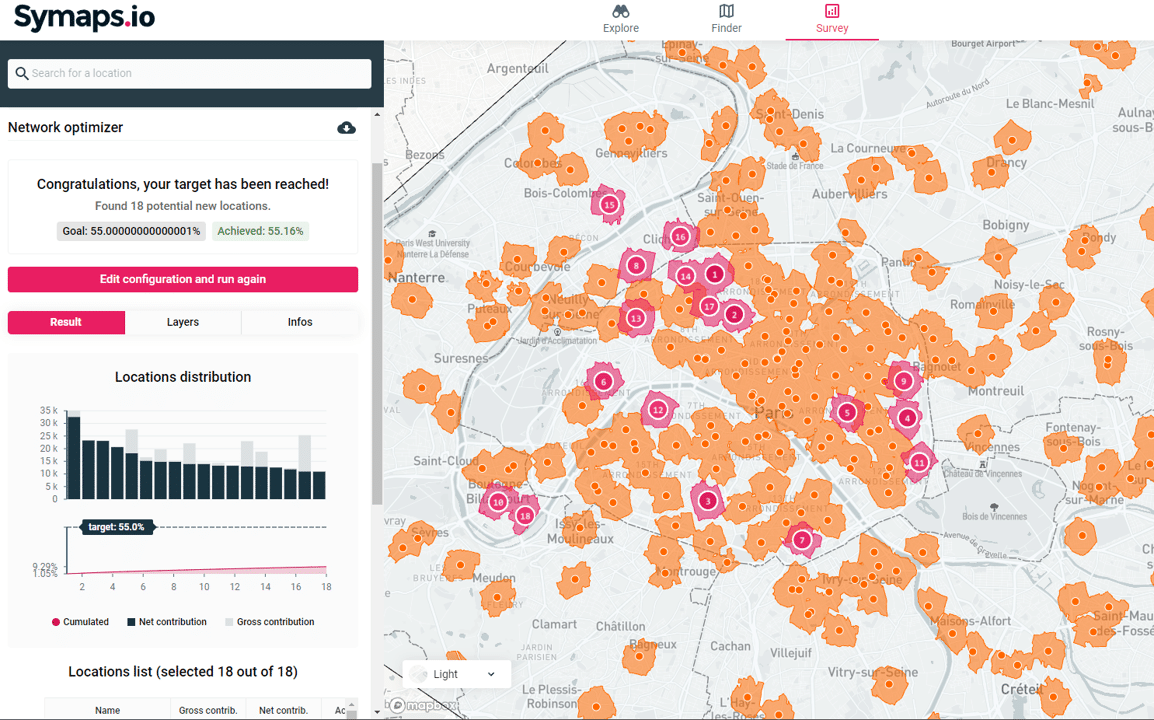
Optimise your existing network
– Assess overlaps with competitors and white zones to identify untapped opportunities
– Evaluate internal cannibalisation
– Identify your touchpoints’ maximum potential and target your actions for under-performing ones
– Less stores but better located: let AI optimise your coverage
Build optimal expansion plans
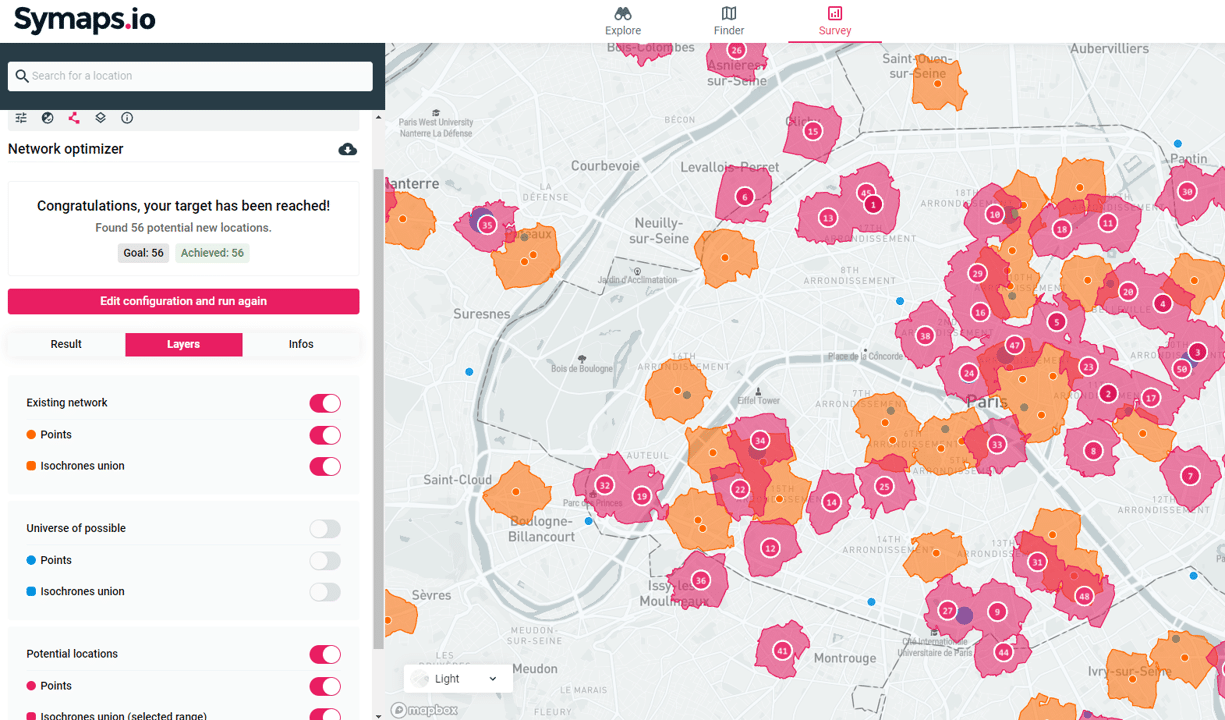
– Find out the number of stores needed to reach your coverage targets and where to locate them
– Simulate expansion scenarios with revenue prediction
– Spot white zones and analyze the potential of new geographical areas
– Correlate the drivers of your stores performance with geolocalised data to replicate your successes
Determine the best areas according to your profile
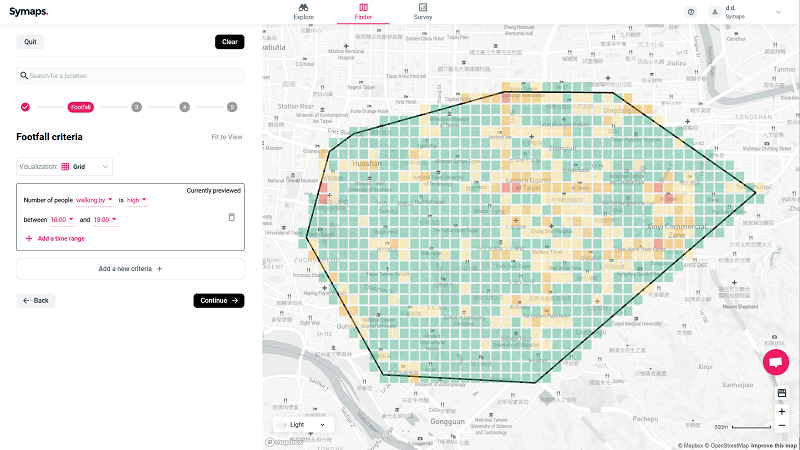
Combine your criteria
– Choose your criteria: population profile, footfall, business & amenities, competitive pressure, etc.
– Get ranking on best locations matching your requirements
– Ex: show areas where the number of people walking by is high between 10:00 and 18:00 AND where there are few restaurants
Replicate success
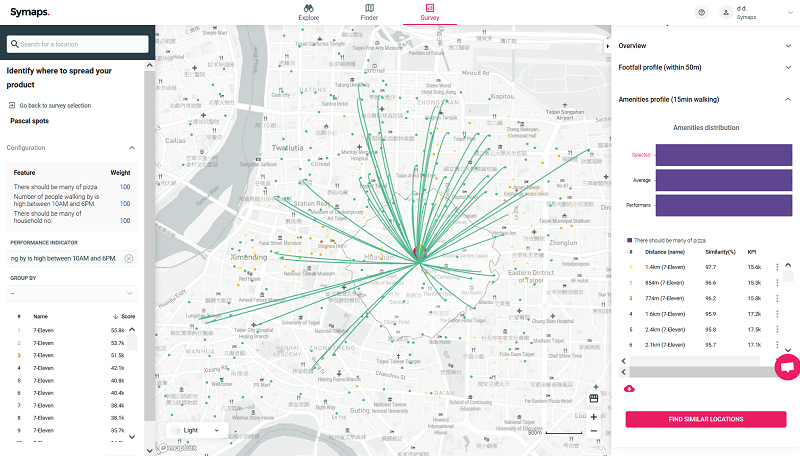
– Select one of your most successful locations
– Find “twin locations” with similar profile
– Segment your locations and get aggregated KPI’s
Add your own data to carry out in-depth geomarketing studies
Upload your own data
– Upload and visualise your own lists of locations and store KPIs (location, size, turnover,…)
– Enrich your own data with geodata from the platform
– Use enriched data for your coverage and expansion analysis
Download reports
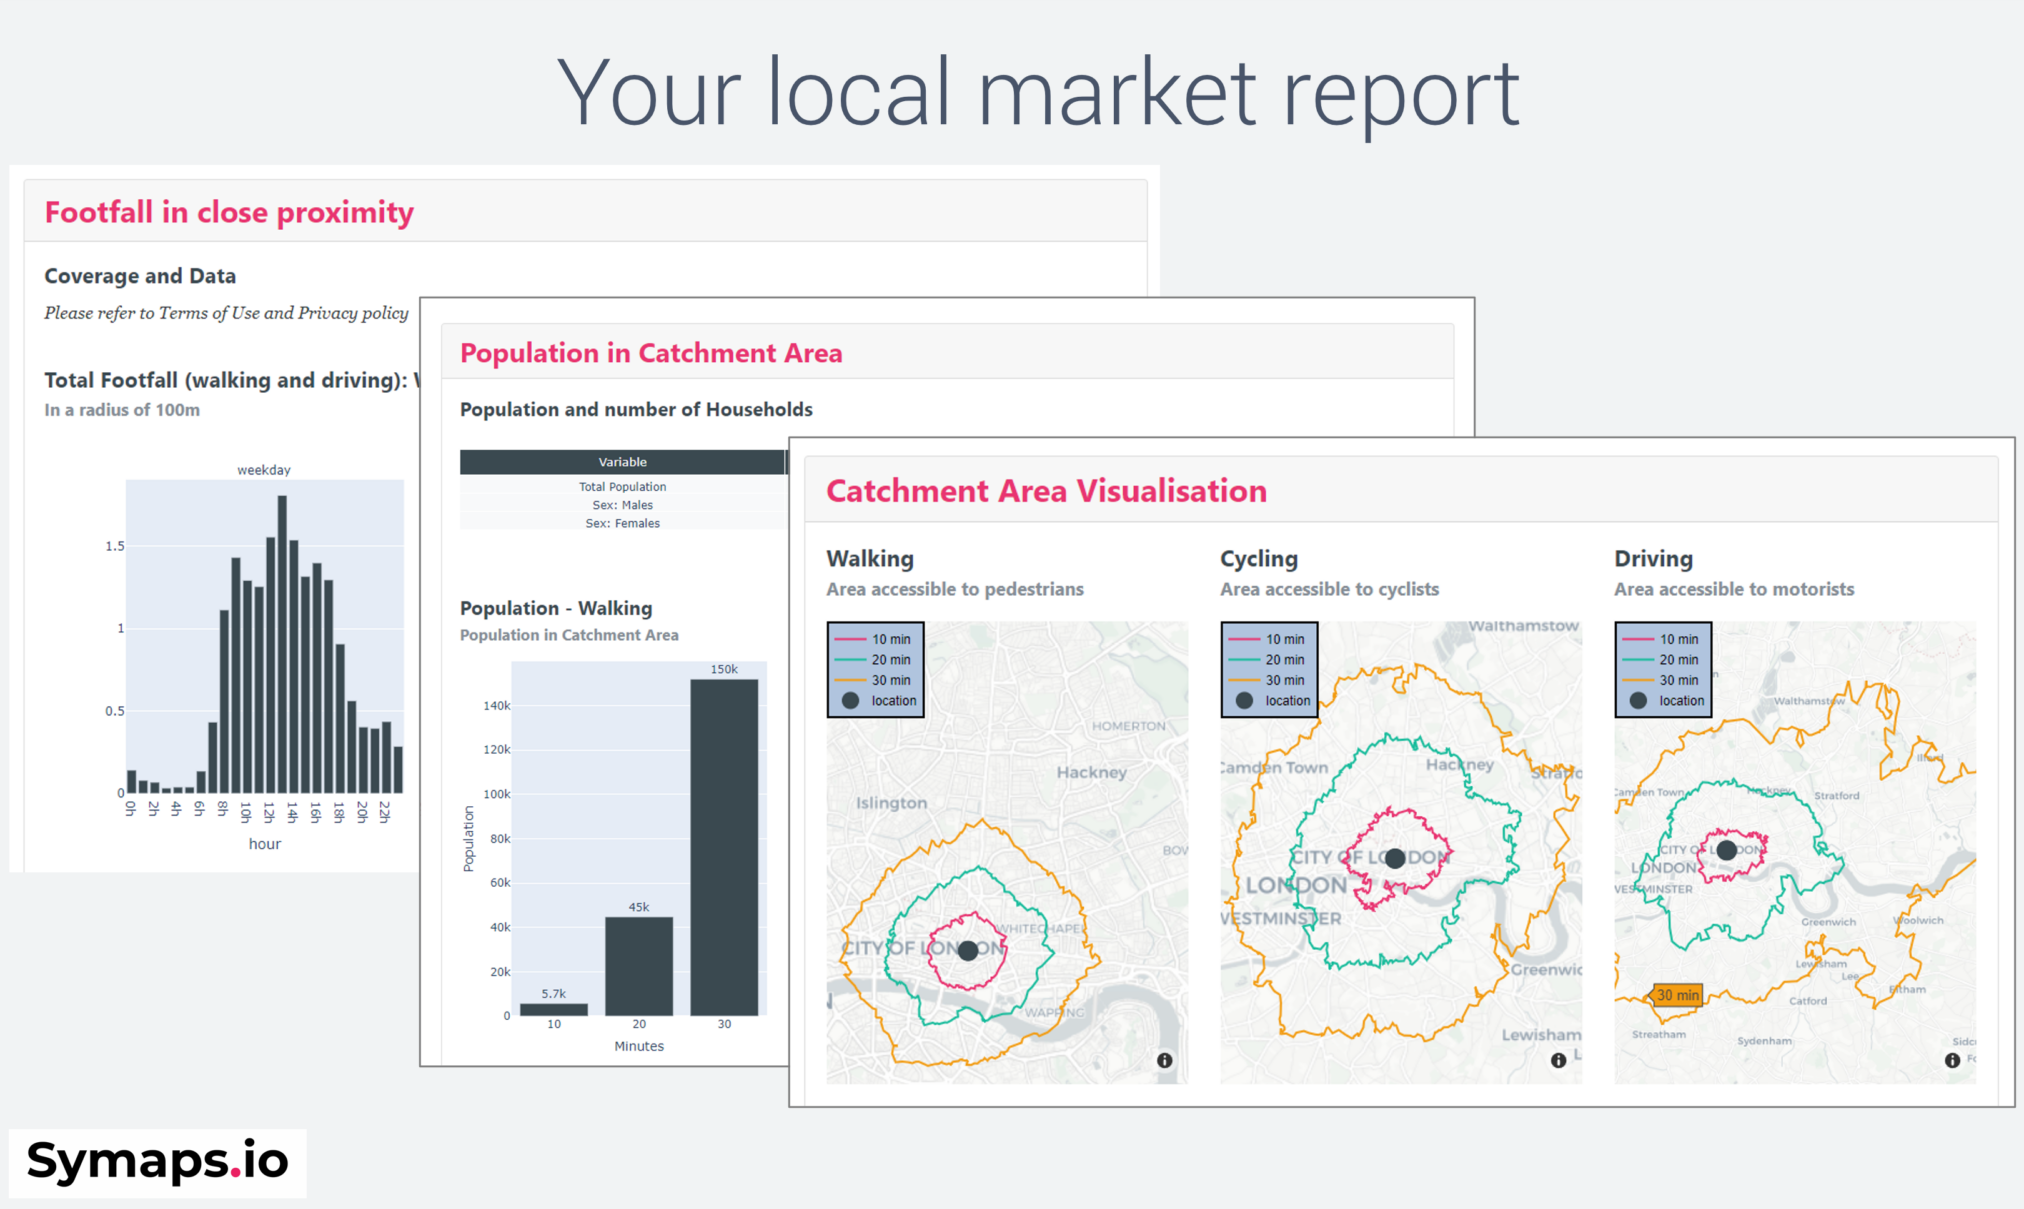
– Easily export maps and analysis results for your internal reports
– Download location reports for your local market study (special franchises)
Book a Call and a Free Demo
Contact Us Today!
- Let’s talk about your project by phone during a 30 minutes call
- Get a personalised live demo
- Learn more on how to save time and money for your location decisions thanks to Symaps’ AI based solution
