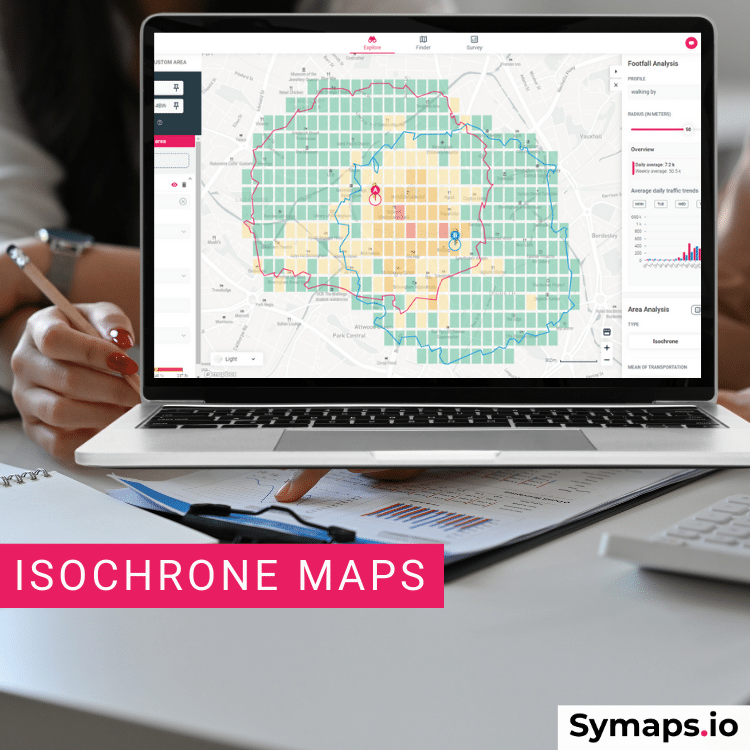
Isochrone map
1. What is an isochrone? Definition
An isochrone curve connects on a map all the points that can be reached in the same travel time from the starting point.
An isochrone map shows the geographical areas delimited by these isochrones curves.
Isochrones are defined in terms of travel time for a given mode of transport, for example: 15 minutes on foot, 10 minutes by bicycle, or 30 minutes by car.
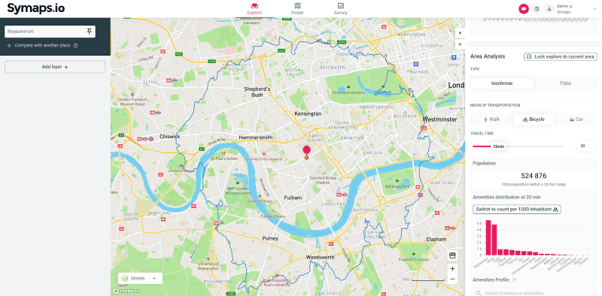
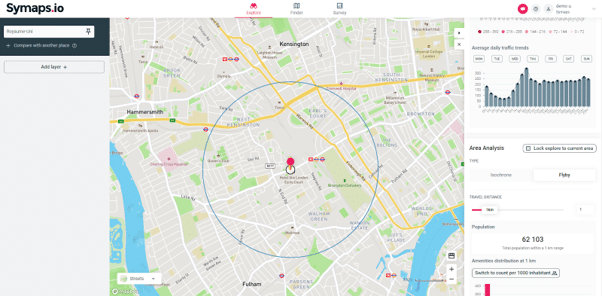
An isochrone map differs from an isodistance map, which represents the distance as the crow flies around a given point without taking into account the reality of travel time. It is measured in units of distance, such as 50 meters around a point or 3 km around an address.
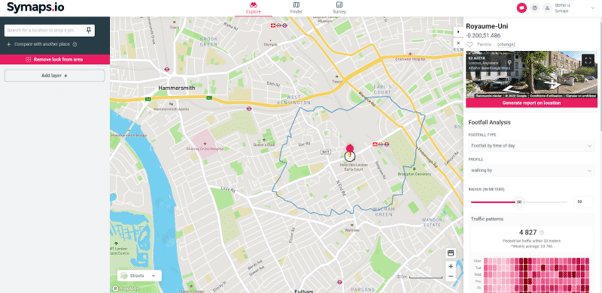
In the world of business, isochrone maps are used to study the catchment areas around a sales outlet or to study a delivery sector
A more detailed local market study will enable to determine the volume and profile of the population located within the catchment area of a sales outlet, as well as other shops and facilities located in the trade area.
2. Travel time: how to draw an isochrone on a map?
Many online tools exist to draw isochrones, isodistances and catchment areas.
Symaps makes it very easy to draw isochrones for any address on the map.
To draw an isochrone, choose the address to be studied in the left-hand panel or by simply placing a pin on the map.
An isochrone curve will be automatically displayed, set by default to show the area within a 15 minute walk of the selected point.

In the right panel, you can change this setting by selecting the desired mode of transport and the desired travel time.
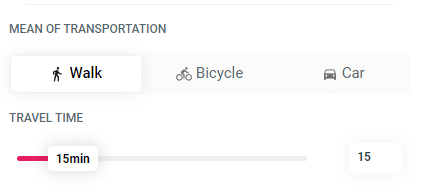
It is also possible to display isodistance curves around a point on the map by adjusting the distance in the right menu.


3. Compare isochrone maps
Compare different travel times around the same point
Comparing isochrone maps is essential for gaining valuable insights into different areas and their unique characteristics. By comparing isochrones of varying travel times, such as 5-15-30 minutes, you can assess the extent of their potential customer base and the reach of your products or services. This comparison reveals areas with fluctuations in population density, footfall patterns, and the availability of amenities and facilities.
Compare isochrones and trade areas
Comparing isochrones and trade areas helps identifying areas with similar or contrasting demographics, footfall patterns, and amenities.
Evaluating each of these factors in parallel gives a deep understanding of the market potential of various locations. It offers valuable insights into potential market opportunities and facilitates site selection, targeted marketing campaigns, assessing location performance, and developing effective expansion strategies.
Example of isochrones analysis
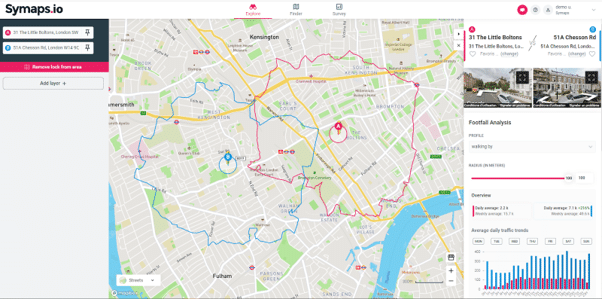
Compare the isochrones around two addresses only takes a few clicks with Symaps: simply add another point on the map. The two isochrones will then be displayed, and you can compare data on population, footfall, and nearby facilities and shops in the right panel.
In this example, point A and B have similar profile in terms of population nearby.
However, point B – in blue- is located in a much more frequented area (more than twice footfall around the place) as shown in the graph below. A business highly depending on footfall, such as restaurants, convenient stores, bakeries… would most likely consider location B as the business potential is higher.
More details? Check our post on how to master your retail trade areas analysis to learn more.
4. Isochrone map in retail: how to analyse the trade area?
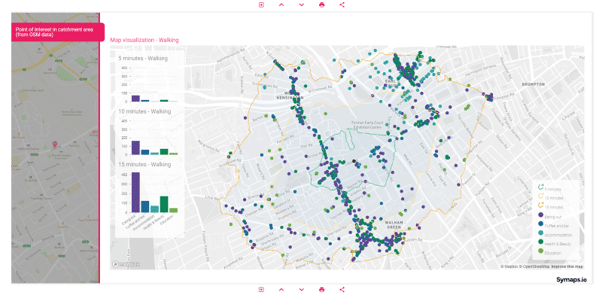
Symaps allows you to analyse data related to a location and its catchment area. By default, several data are automatically displayed in the right panel: pedestrian and car flows and traffic within a 50 m radius of the selected point (this value can be adjusted), the total population in the isochrone zone, and the number of facilities and types of shops located in the area.
For a more detailed analysis of the isochrone map and the primary, secondary, and tertiary catchment areas, you can automatically generate a local market report.
From the right tab, click on “Generate report on location”.
Choose the type of area being studied: urban, semi-urban, or rural.
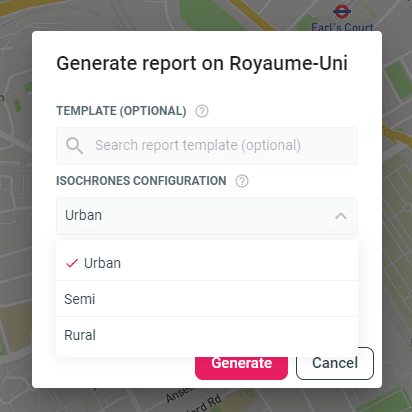
This parameter allows you to correctly size the catchment areas being studied, by adjusting the size of the isochrones. While an isochrone zone less than 20 minutes away by car may be appropriate in rural areas, this may not be the case in urban areas. The Symaps tool helps you personalize the typology of the area being studied in order to adjust the isochrone zones.
Then choose the language of the report (English or French) and click “Generate”.
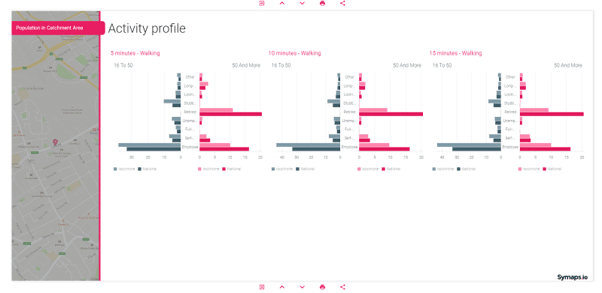
A full, detailed report on the surveyed area is then displayed with detailed data on the area. The report is easily exportable.
Note: the Symaps platform allows its users to test and explore many geographical areas in order to find the best locations for a brand, based on its own characteristics. If you simply want to check the commercial potential of certain addresses, it is possible to order a detailed local market study
Want to Learn More ?
Symaps helps organizations make smarter location decisions since 2017.
> Sales network audit: are you located in the right places? Is your sales network properly sized?
> Expansion and location planing: which areas should you target first?
> Sales network performance: Have your touchpoints reached their full potential?
Contact a Location Expert
- Let’s talk about your project by phone
- Get a personalised live demo
- Learn more on the benefits of location intelligence for your brick-and-mortar investment decisions thanks to Symaps’ AI based solution
